


🧙♂️ The ONLY STOCK VALUATION Tool You Will Ever Need 🧮
Sharing a complete Excel model for stock and options evaluation

My dear fellow Hermits 👋
Many of you have asked for solid references on evaluating a company.
We all know evaluating companies is no walk in the park 🏰🔍 - quality and numbers can get complicated. But don’t worry, we’re here to make it easy 💡✨.
We’ll break down both the qualitative and quantitative sides so you can analyze businesses without the headaches 🚀📊
So, in this post, we’re providing a straightforward, curated valuation model packed with green flags to assess a business 360º. We’ll even throw in a brute-force Black-Scholes options valuation model (just in case you also want to assess derivatives).
Here’s what you’re getting:
✅ A universal stock valuation model – because one size can fit most 📈
✅ A handy ratios calculator – no more digging through spreadsheets 🔢
✅ A detailed qualitative checklist – because numbers alone don’t tell the whole story 🧐
✅ An options valuation model – Black and Scholes, but on steroids ⚡
We’ll walk you through how to use them, and you’ll find a downloadable copy waiting for you at the end 🎁
It’s quite a big file, so please be patient while downloading it.
Let’s dive into it! 🚀


Trust Your Gut - But Give It the Right Tools 🧠🔍
At the end of the day, your best valuation tool is you - your experience, instincts, and judgment should always take the lead when analyzing businesses. That said, having powerful, easy-to-use tools to back up your insights can be a game-changer. 🚀
This model keeps it simple: just tweak the blue font cells, and you’re good to go! No unnecessary complexity - just straight-up, actionable valuation. ✅

How to Adjust Each Cell (Major Ones in Italic)
🔹 Ticker, Country Code, and Sector – Filling these in helps keep your company analyses organized and easy to track. Once done, you can store the file in a larger Excel sheet with all your other valuations for quick reference
🔹 Scenario – The model includes three preset scenarios to adjust assumptions easily. Just click the cell and select one from the dropdown. By default, we use the Intermediate scenario for a balanced approach

🔹 Model Duration – We typically set this to 10 years, but for high-growth tech companies, a shorter time frame (like 5 years) can make more sense
🔹 1st EPS Growth – Since the model is profitability-driven, we use a 5- or 10-year average of EPS growth to smooth out any short-term volatility
🔹 2nd Start Year – This helps the model slow down growth projections over time. We usually set it at half the model duration - so for a 10-year model, that means year 5
🔹 Earnings per Share (EPS) – Use the most recent trailing twelve months (LTM) EPS, or a normalized figure if necessary
🔹 Share Reduction % – Designed for share buybacks, this lets you input an annual % reduction in shares outstanding, which is factored into the valuation. If you expect dilution instead, just enter a negative percentage
🔹 Current Dividend – Enter the dividend distributed over the last twelve months (LTM) or use a normalized figure
🔹 Change in Dividend Payout – This estimates dividend growth based on increasing payout ratios. Example: If a company earns $10 and distributes $4 (40%), but next year earns $11 and distributes $5 (45%), this input adjusts for that 5% increase
🔹 Required Rate of Return – Think of this as your opportunity cost. It factors in capital costs, liquidity risks, company size, and other risk factors. We like to keep it at 15%
🔹 Expected End PE – The projected earnings multiple at the end of the model’s time frame
🔹 Current Price – The stock’s current market price (per share, not market cap)
🔹 Discount – The margin of safety you require to justify a purchase. The standard is 50%, but you should tweak this based on risk tolerance and company specifics.
We’ve also included a few ratios that can provide some guidance on the state of the company’s financials. To use them, simply fill in the numbers in blue font.

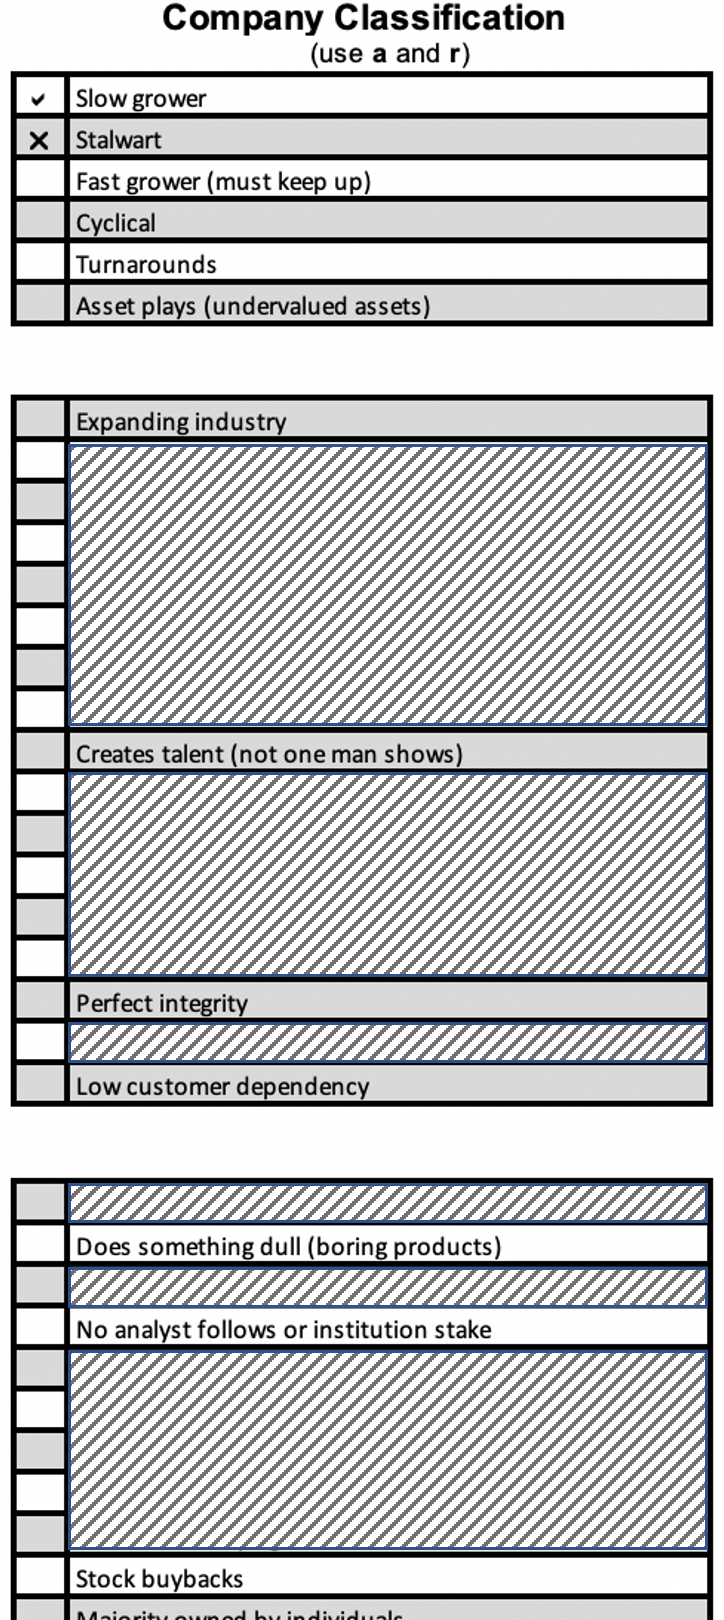
Qualitative Checklist
More importantly, we’ve put together a comprehensive checklist to help you evaluate and compare this company effectively. While many items might seem like obvious green flags, we’re confident that the more you use it, the more hidden gems you’ll uncover 🔍✨
Think of it as a built-in safety net - designed to help you avoid costly mistakes and minimize errors of commission. Because sometimes, the best investments are the bad ones you don’t make 😉
Black-Scholes Options Price Model Explained
The Black-Scholes option pricing model calculates the fair value of a European call or put option.

Here’s a breakdown of the key variables in the formula:
🔹 S (Stock Price / Underlying Price) – This represents the current price of the underlying asset (stock, index, etc.). It's the price at which the asset is trading right now
🔹 K (Strike Price) – This is the predefined price at which the option can be exercised. For a call option, it’s the price at which you can buy the stock. For a put option, it’s the price at which you can sell it
🔹 r (Risk-Free Interest Rate) – The theoretical risk-free return over the option's lifetime, typically based on government bond yields (like U.S. Treasury rates). This accounts for the time value of money
🔹 T (Time to Expiration) – The number of years (or fraction of a year) until the option expires. More time generally increases the value of the option since there’s a higher chance of price movement in your favor
🔹 σ (Sigma / Volatility) – The annualized standard deviation of returns of the underlying asset. This represents how much the stock fluctuates—higher volatility increases the option’s value since there’s a greater chance of hitting a profitable strike price

🔥 Valuation Tool 🔥
🙏 Feel free to ❤️ and comment so that more people can discover and enjoy this Substack 😇
Been using valuation models since before Excel existed. This forces you to slow down and think. In a market driven by instant gratification, that's worth its weight in gold.