


💼 Apr/25 Interim Update: Reciprocal Tariffs
Tariffs, Tumult, and a Touch of Capitulation: A 6-Minute Dive Into Market Madness

Welcome back dear fellow 🧙♂️ Hermits 👋
Want more context? Track the journey so far:
💼 The Hermit Portfolio: March(previous) Update

Briefing
Special Edition Alert
Consider this another extraordinary edition of 💼 The Hermit Portfolio (THP).
📰 During times of market turbulence, we’ll periodically drop these write-ups to help our 🧙♂️ Hermits 🧙♂️ digest the noise and deliver a few valuable insights on our companies and portfolio — all in a quick 6-minute read.

Next week, get ready for a concise masterclass 📚 on bond evaluation — featuring hands-on examples from Argentine sovereign bonds 🇦🇷 and high-yield corporate bonds 🏢, both currently offering double-digit annual returns 📈.
Please note that this portfolio faithfully reflects the author’s personal seven-figure investment portfolio.
This publication is confidential and intended solely for the use of the person or entity to whom it is given or sent. It may not be reproduced, distributed, or transmitted without the author's prior written consent. By accepting to receive the full post as a 🧙♂️ Hermit Premium member, the recipient agrees to be bound by the foregoing limitations.
None of the following should be construed as investment advice. Please consult a financial advisor before making any investment decision. You will find a full disclaimer at the end of this post.

📌 Brief
Over the past two days, President Donald Trump announced a 10% baseline tariff on all imports, set to take effect on April 5.
Higher rates kick in on April 9 for select countries — 54% for China (including existing tariffs), 20% for the European Union, 46% for Vietnam, 36% for Thailand, 24% for Japan, 49% for Cambodia, and others.
In response, some countries — like China — have fired back with their own tariffs (34% on U.S. goods), while others, like our beloved EU, appear split: some are weighing retaliation, and others seem content to smile, wave, and hope this all blows over.

As one would expect, this all has led to significant market declines.
In two days, our portfolio declined about 13%, while indices like the S&P and NASDAQ dipped 10.53% and 11.44%, respectively.
We’d hate to get political here, so let’s just say the following:
[insert long, incoherent screaming]
So… the big question: Is this a good time to buy?
The answer, as always, is yes, but…
Here’s where most people would drag you through a 10-minute detour just because they’ve got your attention.
We hate that.
So let’s cut straight to the data so you can form your own view of the matter.
We don’t think this is the bottom, but it’s a pretty solid entry point. Why? Because momentum tells us mispricings don’t last forever.
Bargains don’t stick around.
Here’s the 50-day moving average for the S&P:
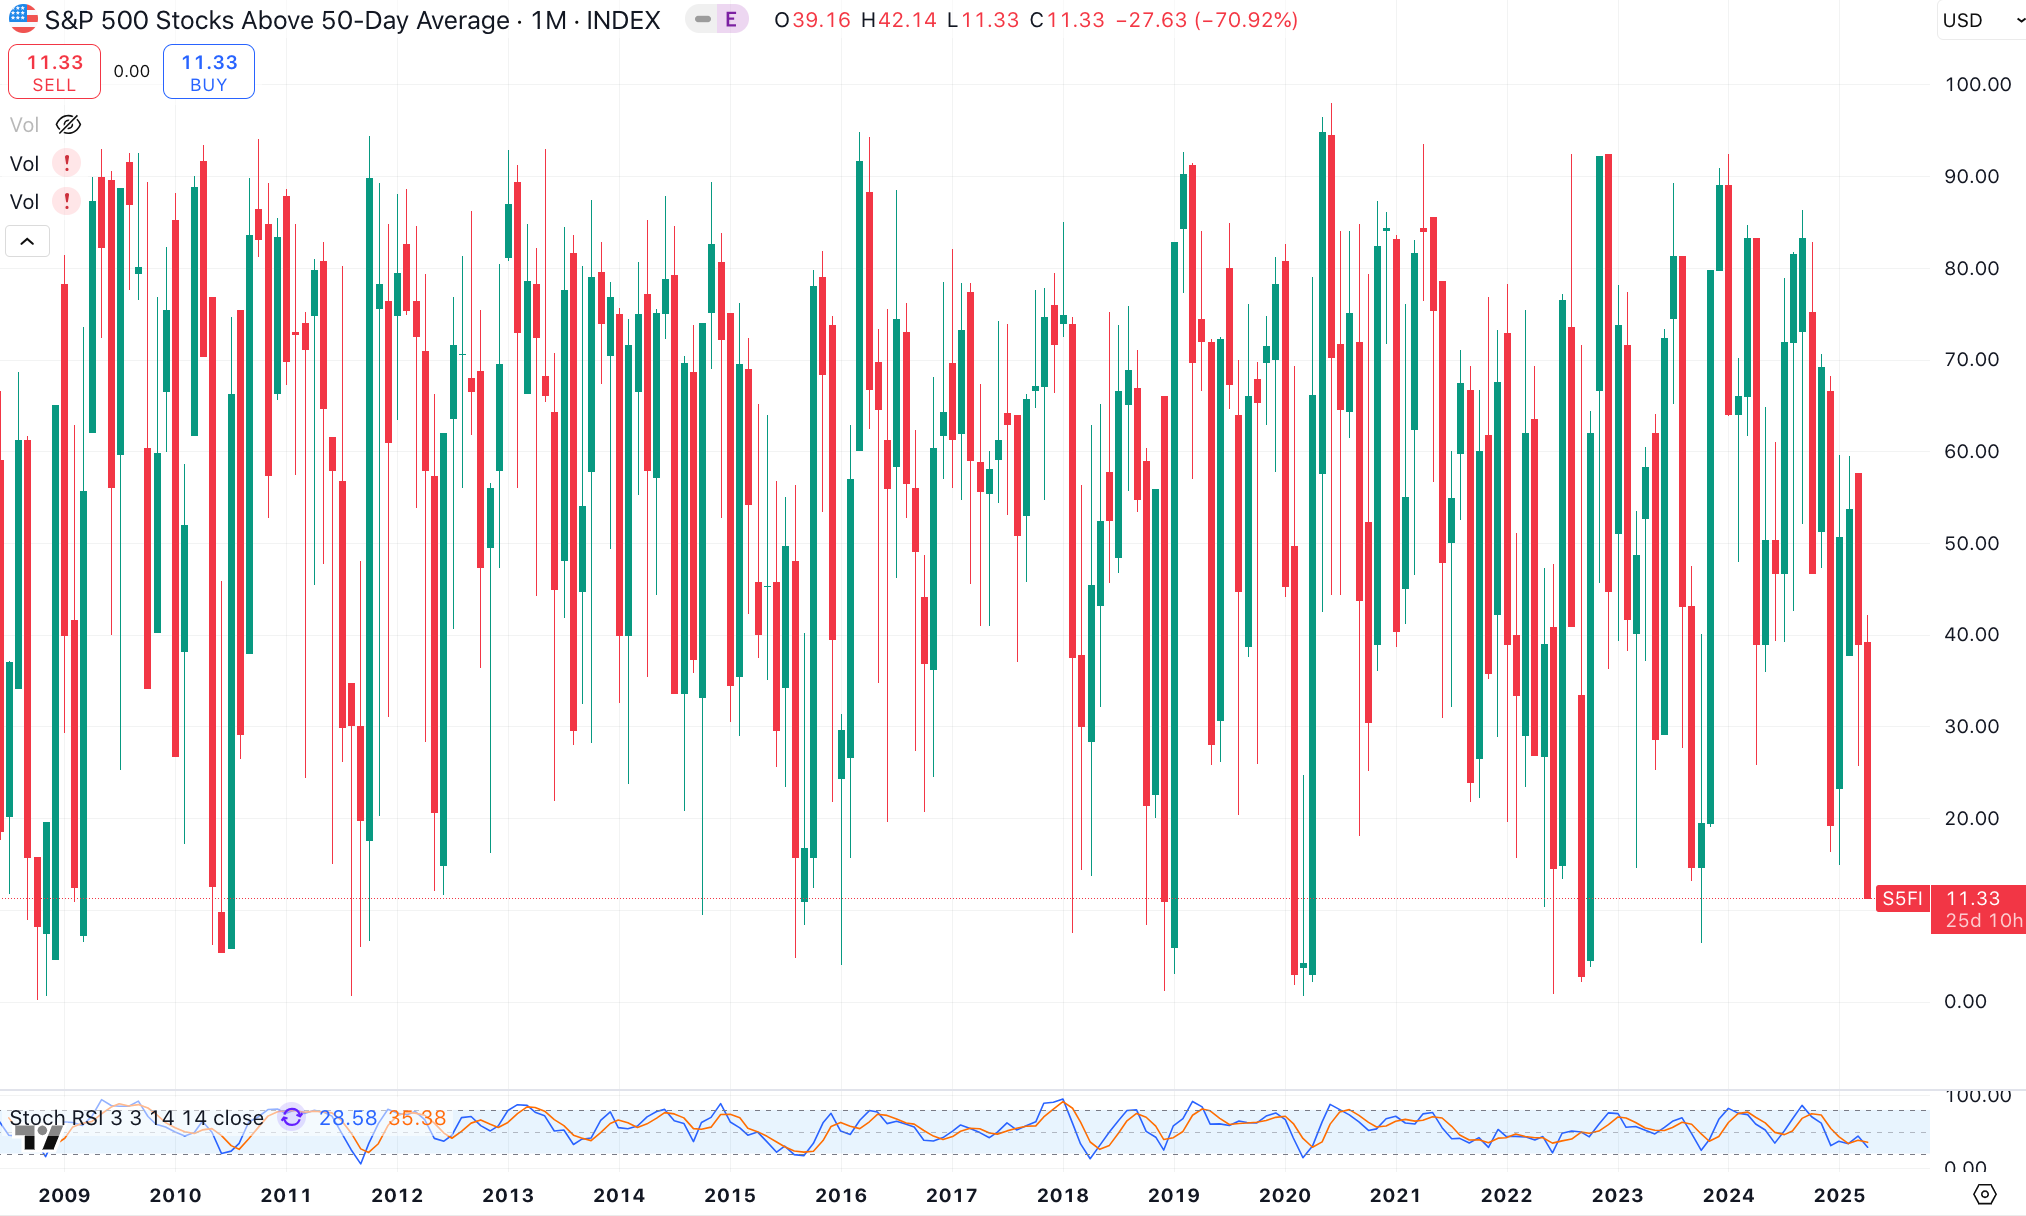
When looking for attractive entry points, we want to see both the 50-day and 200-day moving averages at low levels — that’s when opportunity tends to knock.
Here’s the current 200-day moving average for the S&P:
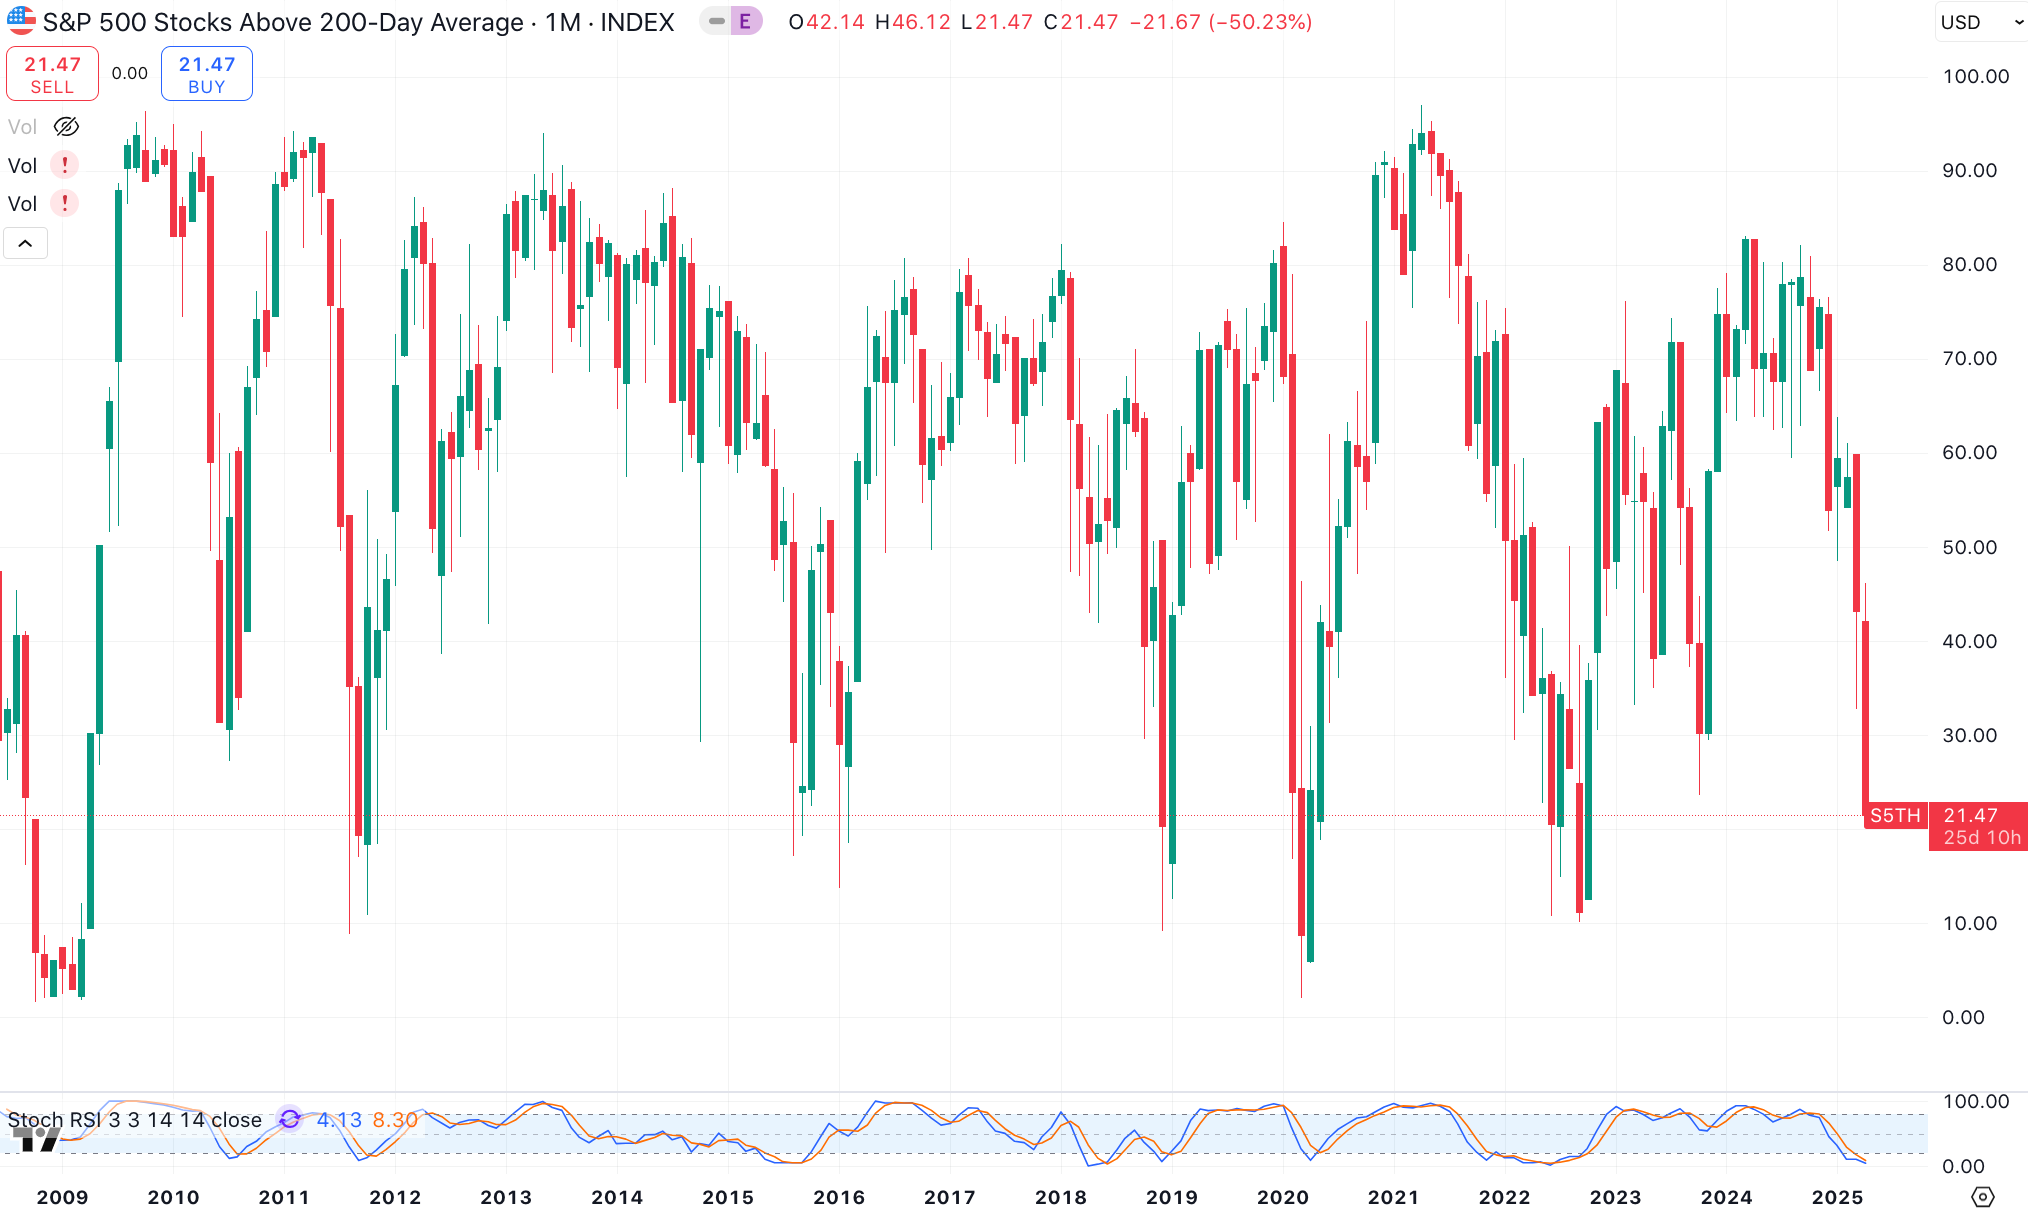
This second chart shows the percentage of stocks above the 200-day moving average dropping to 21, meaning 21% of S&P 500 stocks are trading above their 200-day moving average.
When combined with the first chart — showing short-term momentum also rolling over — this signals classic capitulation.
For us, capitulation typically occurs when the percentage of stocks above the 200-day MA falls between 10% and 25%.
Many things can happen from now on, but we like our odds as they are right now.
Here’s what we did: