


📈 Cardlytics $CDLX - The Ultimate Ad Platform
Reimagining the Investment Case for Cardlytics

Welcome back dear fellow 🧙♂️ Hermits 👋
💳 Cardlytics Coverage 👇
Here’s Every Article on Their Platform’s Expansion
If you haven’t yet, subscribe to get access to this post, and every new post

Investment Thesis is a series of posts that provide a foundational understanding of listed wunderkind companies. The series aims to achieve a timeless understanding of the company's inner workings. Every month, content on an investment case will be posted as an article, podcast, or both.
This content is intended for informational purposes only and should not be taken as investment advice. The author does not represent any third-party interest, and he may be a shareholder in the companies described in this series.
Please do your own research or consult with a professional advisor before making any financial decision. You will find a full disclaimer at the end of the post.

Context
How Cardlytics operates
Key banking and advertiser partnerships
Founders
Early struggles and growth
The Business
🧩 Added Value and Parties Involved
For Advertisers
For Banks
For Consumers
For Cardlytics
📊 Cardlytics’ Profitability Model Explained
Revenue breakdown and financials
Trends in revenue distribution
Bridg acquisition
Dosh acquisition
Entertainment acquisition and sale
Development of Rippl
🔗 Multi-Touch Attribution (MTA) vs Randomized Controlled Trials (RCT)
Industry standards vs Cardlytics’ measurement approach
💳 Credit Cards and Interbank Transaction Fees Explained
Role of fees in traditional rewards programs
Impact of regulatory pressure
👥 The Team
Key executives and their roles
🏰 Drivers of Competitive Advantage
Data security and closed-loop system
Banking relationships
White-label branding strategy
Comparison with other advertiser platforms
ARPU and MAU trends
Insourcing the product
JPM and AMEX case studies
Key competitor
Data-driven advantages of Cardlytics
Investment Case
Bank promotion strategies
Impact of AMEX partnership
Growing role of mobile adoption
Misunderstanding and Edge
⚖️ Valuation
ARPU growth potential
Market expansion opportunities
Competition among advertisers
Potential limits to advertiser growth
⚠️ Risks
Overpromising and underdelivering
Talent acquisition and retention
Data security risks
Suggested readings and analysts to follow


Business Model Overview
Cardlytics has developed an advertiser platform integrated into the digital channels (web and app) of traditional banks and neobanks. This platform allows advertisers to directly address bank users with hyper-targeted cash-back offers. Cardlytics’s bank partners process +55% of all transactions in the US which feed into a real-time database. Thus, enabling action on quasi-perfect information on a substantial portion of the population.
The company serves most major US banks (Bank of America, J.P. Morgan, Wells Fargo, US Bancorp, American Express, etc.), several UK institutions (Lloyds, Monzo, etc.), and a few neobank platforms (mainly Venmo). In the past, these organizations financed cash-back offers with profits from credit card charges, but these have limitations (more on this later). This alternative presents a set of targeted offers financed by advertisers, personalized for each financial institution, and powered by Cardlytics. Offers look something like this:

Origin Story
Cardlytics was founded in 2008 by Scott Grimes and Lynne Laube, Capital One bank employees who thought it would be interesting to implement campaigns within the banks. Their approach differed from competitors in a simple yet powerful core feature: They built the infrastructure so the data never left the banks’ servers.
Their winning innovations played out like this:
→ Advertiser information was collected
→ The campaigns and offers were created and managed outside of the firewall
→ The specs for each campaign were sent to the banks
→ Anonymized target information would be gathered within the firewall by Cardlytics
→ A summary would come out of the back end to adjust the campaigns
Cardlytics got its big break when it won a contract with BofA in 2011. At the time, everyone thought the company would be the next Google, but it turned out it was all about reach and engagement.
Reach relates to the number of Monthly Active Users (MAUs) and engagement is the activation of offers per visualization. Advertisers and users play out a never-ending chicken and egg problem. Scale and reach are required for advertisers to be interested, and users are only interested in sites that provide large quantities of high-quality offers. Advertisers also demand proof of concept without the need for a technical explanation. In other words, they want to see significant results in their numbers (more on this later).
From 2011 to 2019, the company continued to struggle as advertisers were not interested in the small user base (50-70M MAUs at the time). Cardlytics nearly went broke multiple times, and their IPO almost failed. However, in 2018 they signed JPM and Wells in quick succesion leading to an explosion in reach and, consequently, advertiser interest. The company still faces issues today, but size is not one of them.

Added Value and Parties Involved
Cardlytics proposes the following 4-sided win scenario:

For Advertisers. The tool provides best-in-class targeting and measurement. It can infinitely segment customers with great accuracy and thus address the specific needs of advertisers. Common segmentation types are recurring buyers, area of purchase (what they buy), wallet share (what competitor do they buy from), loyalty programs (who are they engaged with), spending deciles (how much do they spend and when), and offer sensitivity (how much does an offer affect their behavior).
All this information is then contrasted and tested against a holdout group that can provide evidence for their case of incremental spending. The robust methodology is a much better option than the digitally extended multi-touch attribution (more on this later).
Cardlytics offers lead to a return of 4-5 USD per dollar spent by advertisers. The comparison with other advertiser platforms is quite difficult as Return on Ad Spent (ROAS) is substantially different from incremental ROAS. Meta’s ROAS is about 2 USD, but Meta cannot directly associate sales with spending so the number will inevitably be an estimation. In contrast, if Cardlytics says it provides a $3.23 net return, it means it measured to the penny $4.23 of increment per $1 spent by the advertiser (more on this later).

For Banks. Financial institutions used to fund offers with interbank credit card fees, which limited the offers in both total offer cash-back terms and advertiser budget reach. With Cardlytics, banks receive $0.34 of every dollar spent by advertisers as profit while increasing the reach and engagement of each offer. Even though getting advertising money for free is nice, banks are more interested in customer churn. In bank terms, Cardlytics translates to modified behavior that increases customer loyalty and credit card spending. Ultimately, leading to higher client retention and increased credit card fees.
Let’s look at an example using JPM’s data:
→ The bank has about 80M MAUs. Credit card spending for the entire base was about $426 bn for Q3 2023, about $5,300 spent per customer per quarter ($21,300 per year).
→ JPM charges 2.6% to 3.5% plus a fixed fee ranging from $0.1 to $0.25 for every transaction. We’ll assume JPM closed 7 bn transactions and that these are equally distributed (average ticket $60.86).
→ If the bank loses 1% of its user base (800k users), that would be $17 bn in transactions and $450M to $610M in fees ($442M to $595M in variable fees plus $7M to $14M in fixed fees).
For context, JPM currently makes about $70M from Cardlytics.

For Consumers. Cardlytics offers a best-in-class product for consumers who have historically received coupons, points, or 1-2% cashback for their purchases. Instead, the company provides a high cash limit 10-11% average cashback offer to modestly change spending habits. Cardlytics ultimately promotes and gamifies savings aka encourages very healthy financial behavior.
From the $1 provided by advertisers, customers typically get $0.32 plus whatever banks want to add, which can be significant given the previously explained point. I’ve seen extraordinary offers for Chase Sapphire users (JPM premium) such as $500 cash back for $2,000 spent in a luxury hotel chain.

For Cardlytics. Cardlytics gets the remaining $0.35 in exchange for optimizing offers and bearing the costs related to campaigns, technology, advertiser management, etc.


In addition to the previous points, Cardlytics provides customer insights without the need to extract personal data. With its 170-180 MAUs and growing engagement, Cardlytics can provide advertisers with relevant data-driven information that should benefit all parties as it increases supply, which in turn increases demand, which in turn increases supply.... Once again, chicken and egg that can be summarized with the words of a major investor:
Cardlytics is a broken slot machine - Cliff Sosin (CAS Investment Partners)
Cardlytic’s Profitability Model Explained
Cardlytics has 3 key revenue items that every investor must understand:
i) Billings: Total amount spent by the advertisers
ii) Revenue: Total amount earned by Cardlytics and Bank Partners. OR. Total amount spent by advertisers minus consumer incentives (redeemed offers)
iii) Adjusted Contribution: Total amount earned by Cardlytics including share-based compensation (for sales and distribution)
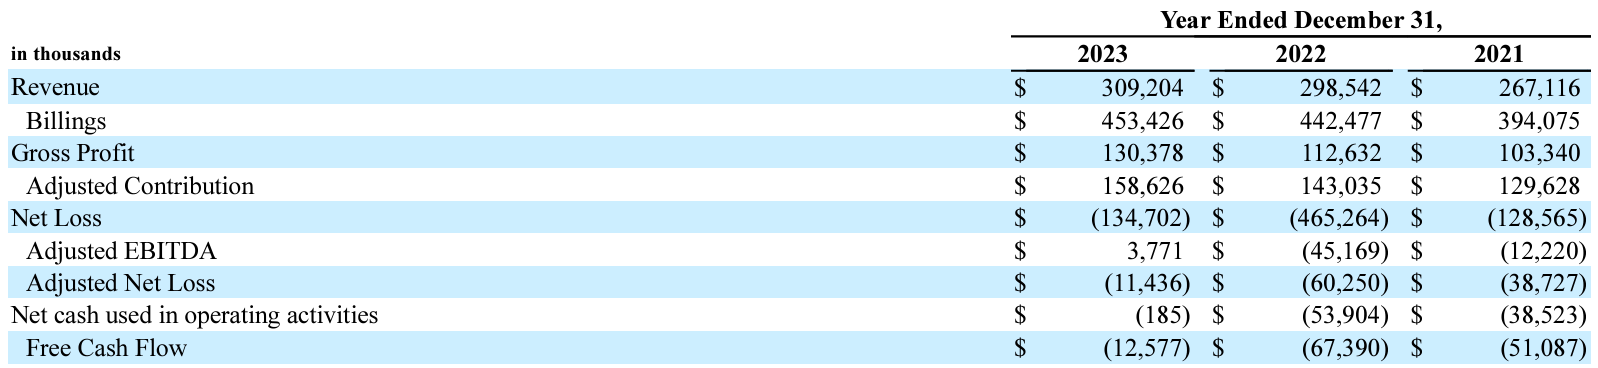
We can observe the trend of Cardlytics increasing its share of the pie as presented in the retained percentage.
Consumers - 31.80% (2023); 32.53% (2022); 32.21% (2021)
Bank Partners - 33.22%; 35.14%; 34.90%
Cardlytics - 34.98%; 32.33%; 32.89%
Cardlytics relies heavily on scale and operational leverage to run optimally. In other words, the company has high fixed costs related to software development and customization for each bank partner. This item is both the main barrier to entry for competitors and the reason behind the company's extreme valuations. The increase in advertiser count, advertiser budgets, user count, and user activity that drive Cardlytics’s revenue does not lead to substantial variable costs. Simply put, as the company scales, its unit economics become extraordinarily good.
M&A and Subsidiaries
Previous management turned to M&A in 2021 and 2022 as it felt the market’s pressure for growth at all costs. During this period,, the company acquired three competitors, intending to purchase their tech stack and reach. In retrospect, Cardlytics paid too much for these. I’ll describe them in order of relevance.
Bridg was acquired in May 2021 for $350M in cash and stock. The company is a PoS data analytics software that provides information at an SKU level (Stock Keeping Unit). The company integrates data from multiple sources to aggregate consumer profiles into a single anonymous identity that can later be targeted with hyper-personalized campaigns. Bridg mainly serves retailers and is partnered with Snowflake, theTradeDesk, LiveRamp, and ThoughtSpot.

Bridg’s contribution to Cardlytics numbers may not appear substantial, but it creates a close loop with the end user creating robust offer targeting. Additionally, it enables SKU-level campaigns (more on this later).
In 2022 and 2023, investors went through a rollercoaster of emotions due to the popular belief that the earnout payment for this company would bankrupt Cardlytics. For a more detailed breakdown of what happened please check Bridg earnout resolution.
Dosh was purchased in March 2021 for $275M in cash and stock. Dosh operates identically to Cardlytics (in practice) but focuses on partnering with neobanks instead of traditional banks. Dosh operates with a more modern tech stack that enables local offers and an easier API integration with modern banking alternatives. Dosh’s key account is Paypal’s Venmo.
Entertainment was acquired in March 2022 for $15M in cash and stock. The company focuses on local SME restaurant discounts through vouchers and coupons. The purchase came as a way to push for geography-based discounts and the development of a self-service platform. With new management returning to the basics, Entertainment was deemed a distraction and consequently sold in December 2023 for $6M in cash and an additional $1M in earnout.
Lastly, Cardlytics developed a data and media network under the brand Rippl that has been steadily growing since its launch in August 2023. The company hosts 70M MAUs comprised mainly of regional retailer users and has insight into $40 bn in spending from +21,000 locations. The initiative aims to create a 360º understanding of customers’ profiles and help retailers monetize users through predictive analytics.
Multi-touch attribution (MTA) vs Randomized Controlled Trials (RCT)
In general, people don’t trust measurement in digital media. In particular, competitors have an inferior quality of measurement commonly known as MTA. Any company using this measurement methodology will result in better-stated returns and lower actual returns. With Cardlytics you get the precisely stated returns. MTA commonly uses one of the following models:
Full path model. Examines all participants’ contributions and rewards accordingly
Linear attribution. Rewards all participants equally
Time decay based. Rewards all participants weighing contributions based on timestamps
W-shaped and U-shaped models. Rewards all participants with the first and last contributors getting a larger share
Custom models. A combination of all of the above

The most common model, the Full Path methodology, will split the earnings proportionately but does not do so based on causation. Instead, the model rewards elements that may have no connection to the product's sale.
Brand and word of mouth are two chief examples that come to mind. How much of a sale can or should be attributed to the repeated exercise of watching ads, observing promotional campaigns, and talking about the product with other users throughout the years? Should we attribute a portion of today’s iPhone sales to the iconic 1984 Apple commercial? Should we pay the team (surely retired) Coke team responsible for turning Santa from green to red? I don’t personally think we should. However, the MTA model, which in theory should attribute a portion of the merit, is, in practice, not paying these people and thus not acknowledging their contribution.
")
Ultimately, MTA does not pay the parties for causation, but instead pays them for action. For this reason, measuring the yield of a campaign is quite hard since you don’t know why the person bought the product or service.
Nevertheless, MTA models are considered the industry standard because of their ability to showcase a message to millions of people in an instant. Their ease of use makes targeting a “non-essential feature”.
Contrary to popular digital marketing skeptics, Cardlytics does deliver on its promise. And it does so by implementing campaigns based on targeting a segmented portion of the credit card-using population.
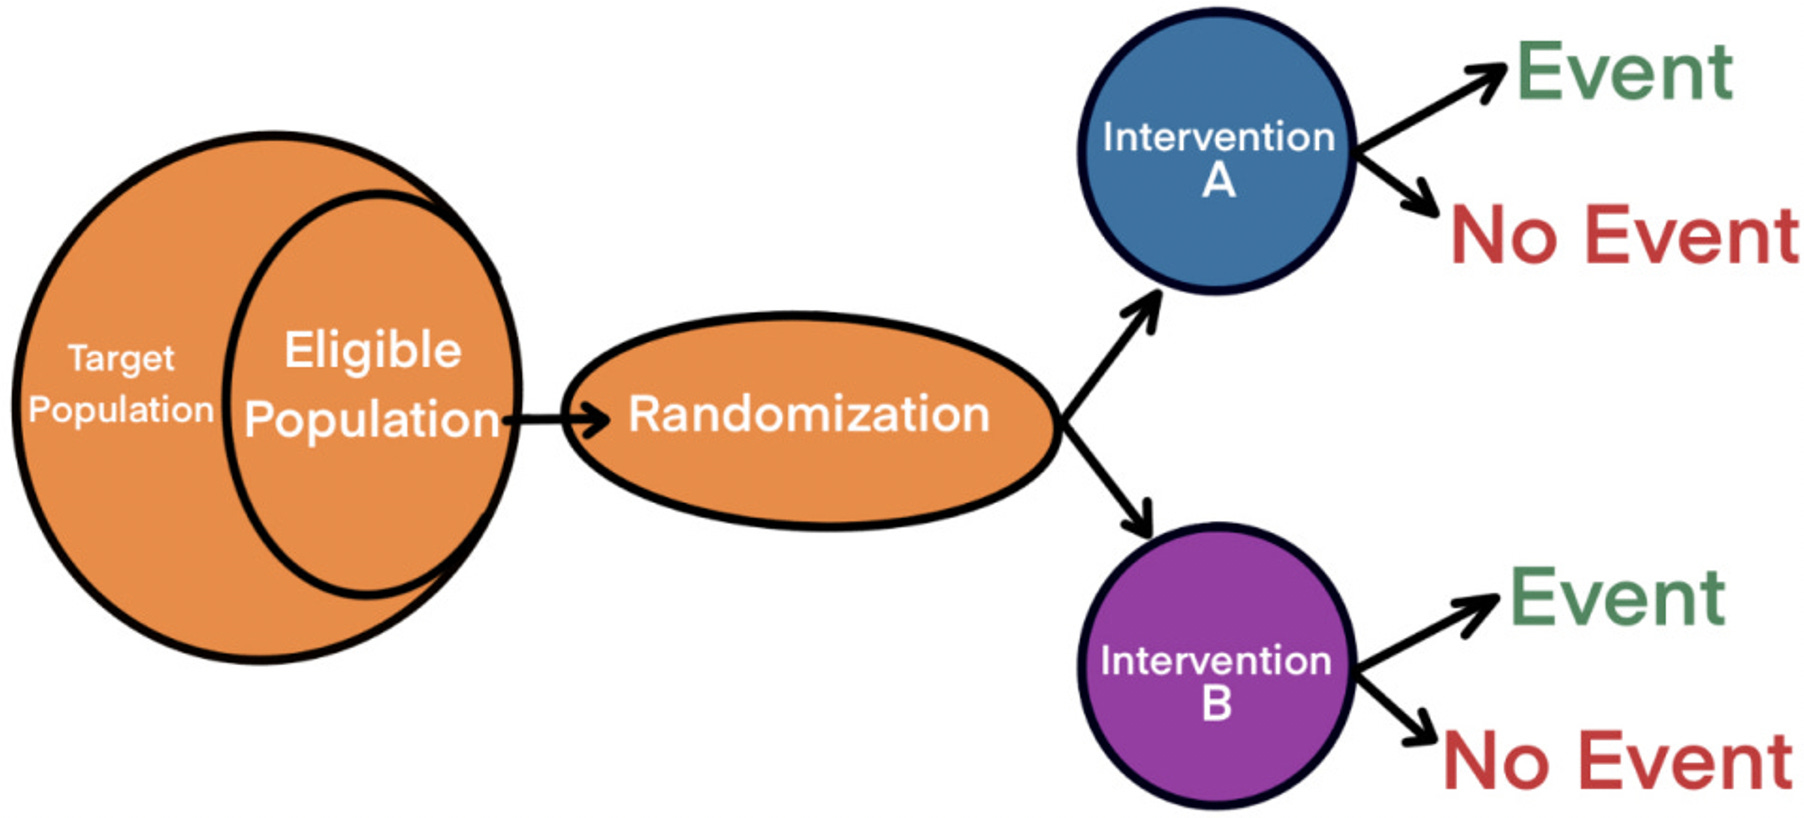
Cardlytics conducts measurements of purchase behavior on two identical (or similar) groups, one is targeted with the ads and the other is not. By measuring the difference between the amount redeemed by the first group and the second, Cardlytics gets the incremental figures. These represent a direct behavioral change of consumers caused by the ad campaign aka attributable returns.
This testing cannot be shown directly to advertisers as data is confidential, but it is retested and published by Nielsen, a third-party independent auditor (more on this later).
Credit Cards and Interbank Transaction Fees Explained
Every time a customer uses a credit card money is deposited into the account of the merchant. However, financial institutions take a cut out of every transaction. This leads to the average merchant receiving 97-98% of the price paid by the customer.

For Cardlytics, the relevant figure is the fee charged to credit card transactions by banks. On average this is 1.5% to 3.5% plus a fixed fee which typically ranges from $0.05 to $0.40. The following terms are the terms set out by JPM to its merchant partners.
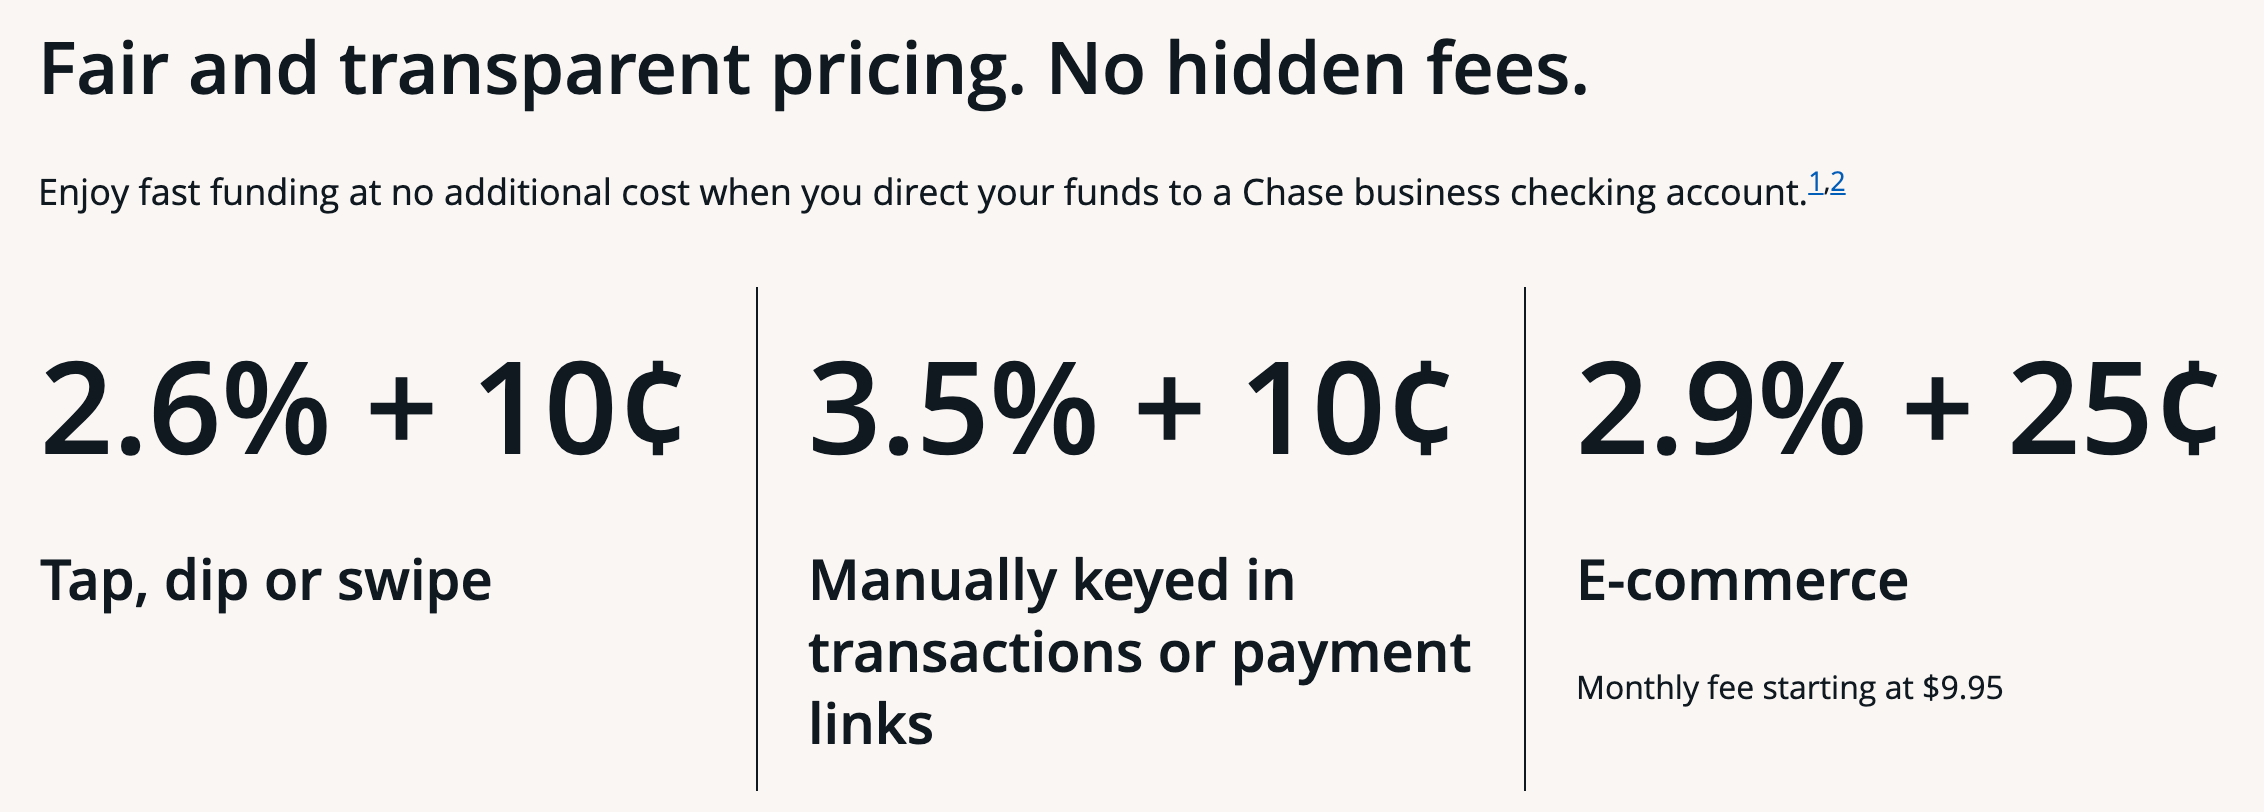
Why are these important? Before Cardlytics came into the picture with advertiser-funded offers, banks typically used these fees as the source of funds for their rewards system. The typical offer involved points that could be redeemed to purchase experiences or consumable goods. The offers quickly devolved from high-tier flights and trips to everyday purchases.
Ultimately to remain competitive, banks transition from points to cash-back minimums. These minimums ranged from 1-3% and were geared towards purchasing groceries, gas, rent, and other routine spending. Banks and credit card networks heavily pushed for higher consumption and turnover rates via the use of credit rather than debit. For context, Cardlytics provides offers with an average cashback of 10-11% on everyday items.
Recently, banks have come under pressure with both credit and debit card fees. Limitations to interchange fees and credit card fees are putting banks and providers like Mastercard, Visa, and AMEX under pressure. For Cardlytics, this presents a strong tailwind as these institutions will not be able to fund attractive offers with fees alone.
Additionally, financial institutions have been in the sights of politicians. Populist leaders, those with an “us vs them narrative”, on both sides of the aisle have pushed for reforms for the rich. Cardlytics heavily benefits from this trend. It’s hard to imagine someone like Bernie Sanders pushing for removing the ability for everyone to save a few bucks.
The Team
Here’s a quick overview of the key people involved in the project. As a side note, Cardlytics went through a phase where higher top talent was not a priority. With the new leadership of Karim Temsamani (effectively since Q4 2021) people, particularly tech developers, have been one of the top priorities.
If I had to point at the top three those would have to be Peter (tech), Alexis (financial viability), and Karim (orchestra conducter). Ian would be a close fourth as the face of the international ambitions of the company.
Karim Temsamani

Alexis De Sieno

Amit Gupta

Peter Chan

Evelyne Foster

Ian Carrington

Drivers of the Competitive Advantage
Cardlytics has built a moat through its improvements in software products, reliability of service, and scale. These elements are hard to replicate partly because it takes a very long time to build up trust when dealing with banks, and partly because the ultimate goal is consistency and differentiation for consumers.
Both elements lead to a natural monopoly state in the industry where banks can either insource the product or outsource it to a single player with scale. The following items are a few of the drivers supporting the thesis that Cardlytics possesses a robust moat:
Closed-Circuit Data. Cardlytics processes and manages data within the bank’s ecosystem. The closed loop remains even after banks transitioned to the more agile cloud version powered by AWS
Cyberattacks. Data never leaves the banks’ servers, creating a barrier to any harm-doers and alleviating the need for Cardlytics to spend heavily on protection and prevention systems. Additionally, Personal Identifiable Information(PII) extraction is nearly impossible as banks anonymize data
Bank Real Estate. Banks have limited and valuable digital real estate that affects offer activation rates substantially. When showing 1 to 3 offers on emails and landing pages, banks want the highest quality offers possible
Measurement Accuracy. Even though this feature is still not acknowledged by some advertisers, it’s only inevitable that RTC becomes the gold standard of digital marketing. To aid in this field, Cardlytics is working on deploying a dashboard by the end of 2024 that will aid non-technical clients
THE White Brand. Even though it might seem counterproductive, no offer has a “powered by Cardlytics” tag. This is done on purpose as each bank wants to have a differentiated service as illustrated by Amerideal, Chase Offers, etc. The white brand is exactly what banks want.
Cardlytics versus the World
How does Cardlytics compare against other advertisers? The answer is simple, it doesn’t. With the creation of digital media players like Meta or Google took over the world by storm providing access to what seemed like an infinite supply of users. Digital marketers heavily relied on limitless search terms which easily consumed advertisers’ budgets given their reach. Patrick O’Shaughnessy brilliantly presents this idea in his podcast with Cliff Sosin on Cardlytics by presenting the contrast of permission versus targeting. Paraphrasing his words:
Google is a great example of permissionless access with suboptimal targeting while Cardlytics represents perfect targeting with permissioned access to consumers
There is no cap on how much an advertiser can spend on Google, but a $0.30 to $0.35 bribe to consumers does present a constraint to the early adoption of Cardlytics. The way to understand Cardlytics’ progress is by breaking down revenue into its two components Average Revenue Per User (ARPU) and Monthly Active Users (MAUs). The following chart shows an approximate progression of both elements since Cardlytics IPOed.

The company, in its infancy, has grown revenues by adding users to its servers but has not been able to jumpstart its ARPU figures. Cardlytics grew from about 80M users at the time of IPO in February 2018, to about 170M at the end of 2023. Unfortunately, ARPU has hovered between $1.80 and $2.20 per user since inception, with ∼$1.90 at the close of 2023. This compares poorly to its less accurate but larger-in-scope competitors.
Note that the following digital brands’ ARPU graph is from 2019 and therefore has Meta described as Facebook. Meta includes Facebook, Instagram, and WhatsApp.

These ideas are particularly impactful in the US as the monetization of users is much higher in the country. The following graph helps visualize Facebook’s ARPU (ex-Instagram, ex-WhatsApp). Note that the majority of the advertiser budget in this platform comes from SMEs. Cardlytics has opted to serve major brands instead.

The typical offer from other advertisers, in search or visual terms, is significantly richer. To be perfectly honest, advertisers using a large image with text or a video (on the left) have an immediate advantage over the traditional logo provided in offers powered by Cardlytics (on the right).

In my opinion, this presents an incredible opportunity for Cardlytics as, with the promised improvements to its UI/UX, it can provide an experience on par with other advertisers while simultaneously providing optimal targeting.
Presently, logo-type offers limit Cardlytics to big brands since the local pizzeria will not be able to convey their product, quality, and/or ease of access without the improved version offers. This, together with the development of a self-service platform, constitutes the most pressing issue that the company is facing.
Sharing the Pie

The changes can come at the expense of multiple parties. Presently with Cardlytics, advertisers and banks are getting a lot of value from every transaction. On average the model campaign will yield $2.50 ($2 to $3) net incremental revenues for advertisers. On this same transaction, bank partners may only get $0.34 initially, but, in terms of incrementally, the figure is closer to $2.50 ($2 to $3 including increased retention and turnover). Users are getting $0.32 and Cardlytics is getting $0.35.
To sum up, for every $1.00 provided by the advertiser there are increased revenues of at least $5.67 for all parties involved. In terms of proportional gains that represents 5.64% of the pie for users and 6.17% for Cardlytics, which is clearly on the lower side. In the fullness of time, I would not be surprised if the share for both of these parties increases significantly. Why would Cardlytics not retain 10% or even 15%?
Cardlytics vs the Banks
The question remains, why would banks not choose to do it themselves? Insourcing can seem like a very attractive prospect at first. However, banks lack the reach and are more interested in the second derivative outcomes (e.g. transaction volumes and retention). Losing the reach provided by Cardlytics implies losing both the $0.34 provided by the offers and the additional $2.16 derived from the reach. This figure can sum up in the hundreds of millions when accounting for the entire MAU base of a bank.
Additionally, banks are a consolidated sector with low margins and low differentiation. Any push towards making their customers’ experiences better counts. Some banks choose to limit spending on this front, for example, BofA has an antiquated online portal for both web and mobile. Banks can pull this off for years because most clients are psychologically captive.
Think about it, how many people do you know have closed a bank account? Instead, people opt for multiple accounts, until they find substantially better options. At the risk of becoming obsolete, banks must subscribe to this type of program and most choose to do so at the lowest cost (or even generating profit with Cardlytics). Note that pressure from neobanks is rapidly changing accountholder behavior. In any case, Cardlytics is the easy way for non-active banks.
For active banks like JPM and AMEX, Cardlytics presents an opportunity to both generate large amounts of profit and expand their moats. Chase (the commercial branch of JPM) is pushing for an effort to aid its base consumers and digitalize its SME merchant accounts. Alongside this effort it is attempting to build an in-house data analytics solution through its purchase of Figg now rebranded Chase Offers. The company wants to promote local offers to better serve its SME accounts.
Even with this supposed sword of Damocles dangling over Cardlytics head, the company has provided >95% of Chase Offers for the past 3 years. Contrary to popular belief, both the bank and the ad provider’s interests are aligned. JPM tried to launch their inhouse solution in 2016, but was burning absurd amounts of cash. In the end they decided to sign on with Cardlytics in 2018.
The case of AMEX is, to me, even more surprising. AMEX is the unquestionable leader when it comes to offers. The company has a low user count but each user compensates with large amounts of spending and offer redemptions. AMEX has an active foundation of high-spending consumers aka a financial institution’s wet dream.
AMEX churned +$220M in 2023 (the equivalent of billings for Cardlytics). However, their offers were funded with credit card fees which have been under pressure as described above. Partnering with an independent provider like Cardlytics solves for the funding without the need to lose money and ultimately rewards their valued customers with the best available offers.
In essence, Cardlytics can be replicated, but it would take a lot of money and effort. In my opinion, once the self-service feature is out it will be nearly impossible for any bank to develop a competing in-house equivalent.
The Closest Competitor
Cardlytics is heavily reliant on banks remaining relevant. Their involvement with Dosh has provided a substantial moat when dealing with disruptive neobanks. In 2020 the company was facing problems with API development, but their purchase of a new stack has led to winning over a few neobanks. However, the problem remains thanks to players like Rakuten and Square staying in the race.
Both offer apps are not economically feasible at their respective scale. However, they are part of larger institutions habituated to spending large sums of money to capture market share at the expense of prolonged deficits. These well-funded enterprises do not possess, in theory, the reach of Cardlyitcs, but can nonetheless present a problem if the company is found asleep at the wheel.

The closest competitor seems to be Cash App a subsidiary of Square ($SQ:NYSE). The platform boasts 56M MAUs (not accounting for multiple cards like Cardlytics) and provides healthy cash-back offers typically ranging from 5% to 15%. Unlike Cardlytics, the offers are presented in a two-sided network where no bank partners are taking a percentage. In theory this should lead to better offers as the split between CashApp and the consumer incentive should be ~50/50 instead of ~33/33.

Offers provided through Cash App target customers differently from Cardlytics. Cash App’s data comes from PoS systems operated by Square and transactions made using a Cash App card. Cash App incentives are used through its multifeatured ecosystem that allows users to purchase assets like Bitcoin and can grant stocks as rewards for transaction amounts, frequency of use, etc.
In general terms, the information from these transactions is much richer as the provider can track individual items (SKUs) purchased in every transaction. However, rich data does not lead to better offers necessarily. For example, multi-card users can be spending for groceries and gas on one card, coffee and amenities on another, and rent/insurance on a third card. This behavior, strongly correlated with offer activation, is part of the habits of people who need or like to save money.
SKU-level data is a necessary, but not sufficient condition for targeting. Elements like multi card or multibank users help process key elements like the share of wallet and customer behavior patterns. The winning combination is SKU-level data with the full user history. Bridg and Cardlytics provide exactly that.
Furthermore, fragmentation in the banking industry is, in general, good for Cardlytics. A divided market requires a consolidator to make the business viable, and, as proven by 2018 Cardlytics, reach is required to make a compelling case for advertisers.

Misunderstanding and Edge
Cardlytics’ current market cap points to a deep misunderstanding of risks and downside/upside potential for the company. As discussed above there are key elements that make for a compelling case.
The first on the list is bank offer use and promotion. As described, banks benefit sevenfold from using offers to promote retention and transactions. However, people seem to miss the way they promote this. On the one hand, banks can improve offer position and notification through in-app and mobile banners together with email blasts describing the targeted offer.

On the other hand, banks can deliberately choose to make less from each offer. One way of executing this is by subsidizing offers for premium members, thus increasing the portion of consumer incentive to create a more compelling case for redemption. The other way is to give back a portion to Cardlytics if they manage to get certain advertisers on the platform, this is known as the bank’s preferred list.
The second major misunderstanding is the deal with American Express. Note that the deal details have not been fully disclosed. From the disclosed information, we know that AMEX will not take any portion of the earnings. This translated to a 50/50 split between consumer incentives and Cardlytics, leading to very robust offers. In the fullness of time, banks will probably move towards this split as illustrated by the share reduction negotiated with JPM in June 2023.
The third and most important element is understanding what sells in a cookieless environment. Pushing the product is crucial to growing ARPU, especially when the MAU base is growing organically. This is derived from >80% of users activating offers from their mobile devices. As the newer generation takes over, interaction will naturally be greater, but this only holds if people log in to the app. Gamifying the experience and improving the small 10-pixel offer windows is crucial.
Valuation and How to Get There (1/2)
The Cardlytics case is mainly based on this last point: growing per-user spending. As described before, Carlytics's ARPU is $1.92, which is on the lower end, especially in the US. In global terms, the average advertising competitor is expected to surpass $47 in ARPU by 2029.
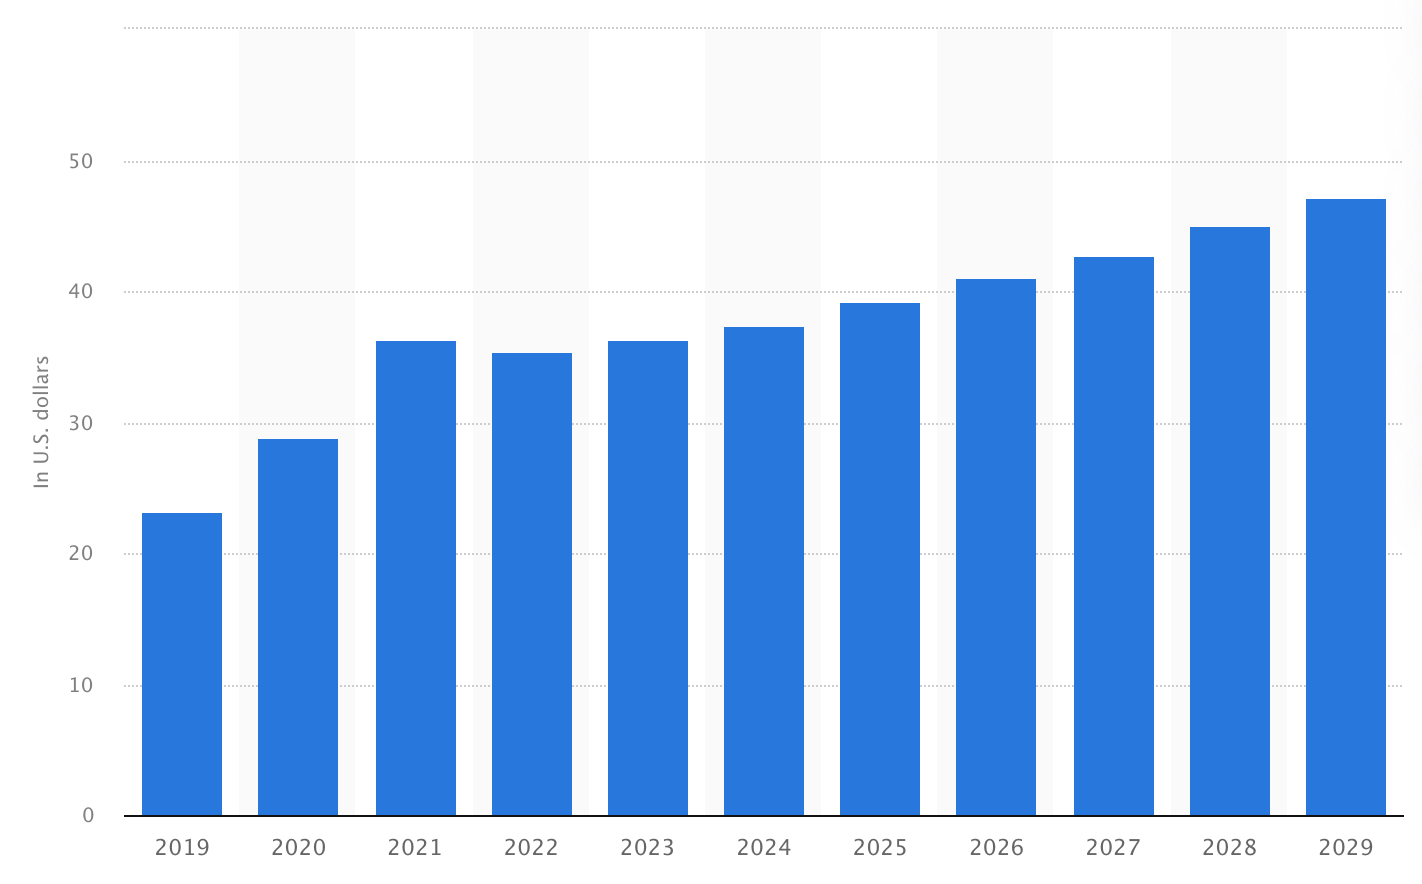
With this in mind, if Cardlytics can achieve a $40 ARPU with a slightly larger MAU base of $200M, we would be looking at ∼$8 bn in revenue. With costs mostly fixed, I would not be surprised if Cardlytics could pull a 25-30% EBIT margin.
Several items have to be addressed to arrive at this figure, but the fact remains that Cardlytics can effectively bribe a portion of the population to change their habits in very moderate terms.
To illustrate this figure, a $40 ARPU would mean about $20 in savings per user per year. With an estimated 10% discount average that would equate to changing $200 of spend per year. $200 out of an average salary (in the US) of $60,000 is 0.3% of the average income. In a bull-case scenario we could talk about changing 1%, 2% or 3% of spend, but once again this is a conservative (and hopefully timeless) estimate of where the company is headed.
In terms of the split, as described above, Cardlytics could take more of the pie mainly by providing lower net returns to advertisers. In other words, instead of a 1 to 4/5 return, the company could serve advertisers a 1 to 2/3 return. Therefore taking the lion's share of the transaction.
And let’s not forget about the boost from mobile adoption.
The Cannibalization Problem
Before moving on let’s consider the problem with growing ARPU. Budget expansion , to an extent, creates counterproductive incentives for advertisers. If an advertiser modifies its competitor’s client behavior, at a certain point this same competitor will attempt to counteract that by applying an equal and opposite force.
In a market with few actors, this game is played out very quickly. Players will use Cardlytics to boost their sales by cannibalizing competitors, but as more players use the offers the number of competitors and potential clients that can be cannibalized decays. This can be visualized using the following completely unbiased infographic.

Understanding the end state is important. Eventually players are forced to pay to counteract effects of other players without getting gains from a sales based marketing. In many cases this is remedied through a more brand-oriented marketing lense, however, the outcome of this type of spending is hard to measure as it relies heavily on MTA.
Valuation and How to Get There (2/2)
Cardlytics can remedy this end state by addressing a growing number of opportunities, the following are some sets of available targets:
Enterprise businesses. The current strategy of Carldytics is increasing sales for large advertisers like McDonalds, Starbucks, Panera and HomeDepot.
Medium size businesses. SMEs, mainly mid-sized enterprises constitute the majority of advertising with approximately 70% of all spending. According to Statista, 8 out of 10 SMEs spend $1,000 in advertising per year and 3 out of 4 use at least 2 different channels to increase sales, drive leads, and build brand awareness. Here’s a very interesting article on how these companies think about advertising.
Advertising agencies. Agencies providing outsourced marketing services mainly to SMEs.
Individuals.
Excluding enterprise businesses, the other participants require Cardlytics to develop and integrate a self-service platform into their current offering. Without said platform, friction levels can be too high for the participants and too costly for Cardlytics.
Self-service refers to an automated campaign manager that is intuitive and accessible for lower budgets. The higher number of advertisers should compensate for the lack of budget if variable costs are controlled. Additionally, intermediaries like ad agencies may want to personalize the portal to demonstrate added value.
For both enterprise and ad agency clients, there is little cost associated with winning them and maxing out budgets. Expansion for certain categories can easily be done with prefabricated solutions for specific verticals. This could lower costs and increase adoption. With these solutions in place, margins should converge towards gross margins as variable costs for new adopters should be extremely low.
Adding services like predictive analytics can boost the differentiation of Cardlytics. Currently, data is a huge moat, but it is contained in banks which are very restrictive when it comes to its use. Summary data can be bought online, but it does not compare with having a full transaction history and a way to talk directly to the end user.
There is a lot of room for optimizing within the platform. Firstly there’s optimizing for positioning within the bank app together with the ordering of offers for relevancy. This is partly being done with JPM as seen in the following example.

Discount percentages can also be optimized as are offer visuals. All to make the product more advertiser-friendly, increase offer sensitivity, and improve communication with the end user.
In theory, hyper-targeted offers can be crafted with specific SKUs, times of day, and locations. This can create both a way for huge increases in engagement/redemptions and, simultaneously, perfect price discrimination. To some extent, Cliff Sosin has talked on multiple occasions about having campaigns on file that are triggered automatically by specific events.
→ Movie theaters can provide 100% discount or even pay for assistance to individuals who are likely buyers of popcorn for empty screenings 30 minutes before the movie starts
→ Ski resorts can provide a 50% discounted pass on rainy days after 10 a.m. (past the usual time of ticket purchase)
→ Starbucks can provide a 30% discount on their highest margin items during off-peak hours

On an ending note for the topic, some advertisers don’t understand the product. Understanding the quality of measurement is key for Cardlytics to succeed. Advertisers may find the measure of incrementally is closer to blind faith than actual results.
For these players size helps and testimonials matter. The way Cardlytics could solve for proof is by randomizing 10 stores or by choosing a specific product within a region providing evidence of incrementality directly in their numbers. This way Cardlytics could increase both the initial budget and ultimately the attributed percentage of total marketing spend. For context, most advertisers spend single-digit percentages of their budgets with Cardlytics.
Risks = Execution
There are many risks to consider in the short term. But, given the focus of this post, I would venture to say that 80% of future performance is attributable to execution. Following the teachings of Charlie Munger, I will invert this section to diagnose the ways the company will die (non-exhaustive):
Overpromising and Underdelivering. Returning to past practices of promising items that cannot be fulfilled will lead to long-term frustration for all stakeholders
Poor Talent. Cardlytics will fall behind if Karim turns to old practices and decides to hire below-par developers and sales employees
Overpaying for Talent. Stock-based compensation can create a great deal for employees, at the expense of a very dilutive one for investors
Neglecting Product Development. If the company does not continue automating and improving its technological stack, competitors will take over
Not Listening to Bank Partners. Each partner will develop according to their need, some in favor of Cardlytics and others at the expense of the company
Establishing a Strong Brand. Without the ability for strong differentiation, the bank partners will look for alternatives
Leaking Data. The discredit from this event, not to mention the lawsuits, would bankrupt the company in months

For more information
If you guys want more information on the company and current events I highly encourage you to check out these posts and publications:
🙏 Feel free to ❤️ and comment so that more people can discover and enjoy this Substack 😇
Thank you Alejandro for your comprehensiv view on $CDLX. It really helps to understand the business model very well. And the idea behind $CDLX is very convincing. What I do not understand is the not so convincing development of the business figures. "Just" 15% top line CAGR since 2018 and far away from profitability. Could you comment on that? Thanks in advance. By the way, I am invested in an ad tech company as well. Verve Group SE (former Media & Games SE) is a leading in-app ad platform (ios and google store in North America and Europe), that grew by more than 50% (organic and anorganic) in a comparable time span, is profitable and has a PER of less than 10 on the basis of last years earnings. Much more competition but less dependencies on a few customers.